summary-report
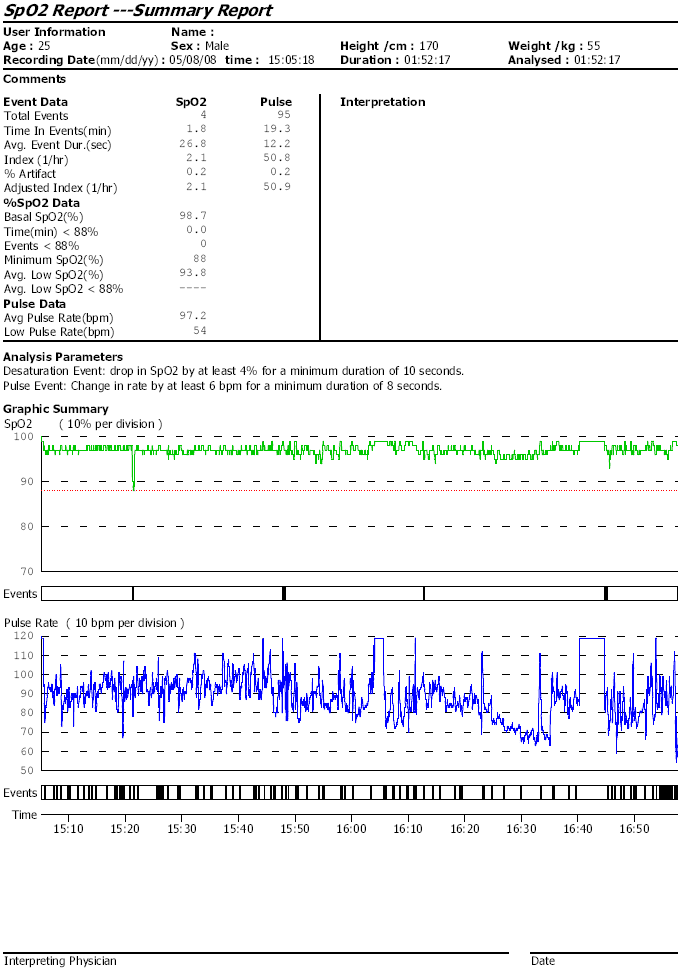
Screenshot of the summary report from the ToronTek-B400 Sleep Apnea Monitor software, displaying detailed graphs of SPO2 levels and pulse rates over a time scale. This image highlights the monitor’s capability to provide comprehensive analysis and visualization of critical health metrics for sleep apnea management. The intuitive graphs illustrate the device’s effectiveness in tracking sleep patterns and identifying potential issues, offering valuable insights for both patients and healthcare providers in the diagnosis and monitoring of sleep apnea
Leave a Reply
Want to join the discussion?Feel free to contribute!